
Breast cancer is a serious disease that must be diagnosed and categorized early to provide patients with an effective and personalized treatment.
Various factors influence breast cancer, including age, gender, and mutations in the BRCA1 and BRCA2 genes, along with breast density, family history, hormonal changes, and previous radiation therapy.
Machine learning has emerged as a beacon of hope in recent years and has great potential for improved prognosis, precise diagnosis, and personalized treatment plans for breast cancer patients. The tumor stages also play a great role in this process.
The current research began with the collection of data from a functional genomics repository called ArrayExpress.
The datasets we selected had the E-GEOD-52194, E-GEOD-75367, and E-GEOD-58135 accession numbers, and then they had been preprocessed through the Galaxy platform, which was connected through the European Nucleotide Archive (ENA).
Data quality is a paramount concern, so we performed comprehensive preprocessing using two essential tools. The FastQC is instrumental for quality assessment in RNA-Seq analysis. It detects errors in data that might be misconstrued as biological signals, and identifies and aids in the removal of low-quality sequences. The FastQ Groomer tool ensures data integrity by checking for errors in FASTQ files and converting them between different formats while adhering to user-defined quality score criteria.
Furthermore, to align our readings, we harnessed the power and convenience of the Hierarchical Indexing for Spliced Alignment of Transcripts 2 (HISAT2), a swift and sensitive tool designed for mapping next-generation sequencing reads (DNA or RNA) to the human reference genome. This tool's use of a small graph full-text minute-space (FM) enhances the precision of read alignment. To mitigate potential issues stemming from duplicate reads, we implemented a two-step process involving the following tools: MarkDuplicates identifies and tags duplicate reads originating from the same DNA fragment. This step is essential for avoiding errors resulting from polymerase chain reaction (PCR) duplicates.
The RmDup, a tool from SAMTools, further refines the data by retaining only the read pair with the best mapping quality when multiple pairs share the same external coordinates. We quantified RNA expression levels using the FeatureCounts tool from the Galaxy platform, leveraging the RmDup step's file. To identify genes with differential expression, we employed the DESeq2 tool, which is robust for analyzing RNA-seq data and providing insights into gene expression differences.
Finally, we conducted pathway and network analysis using the Search Tool for the Retrieval of Interacting Genes/Proteins (STRING) database, which facilitates the exploration of relationships between genes, and their involvement in biological processes, molecular activities, cellular components, and pathways. Additionally, it allows for differential network analysis and the examination of gene pathways. We then performed machine learning algorithms to train our SVM and decision Tree models to reach the results.
For the differential expression analysis, we utilized DESeq2, which employs a negative binomial distribution model to identify differentially expressed genes. Statistical significance was determined using an adjusted p-value (false discovery rate, FDR) threshold < 0.05.
Accuracy, sensitivity, specificity, and F1 score were calculated for the SVM and decision rree models using true positives (TPs), true negatives (TNs), false positives (FPs), false negatives (FNs), precision, and recall as values. The formulas used for these metrics were:
Accuracy = (TP + TN) / (TP + TN + FP + FN)
Sensitivity = TP / (TP + FN)
Specificity = TN / (TN + FP)
F1 Score = 2 * (Precision * Recall) / (Precision + Recall)
We utilized the STRING database for network and pathway analyses to explore gene interactions and biological pathways associated with the differentially expressed genes. Gene interactions were assessed based on the database's default settings and available interaction data.
Confidence Score Threshold: Our analysis relied on the database's default confidence score settings. We did not apply a specific threshold for filtering gene interactions but used the default parameters.
Pathway Enrichment Analysis: The database provided insights into pathway enrichment and biological processes. No additional statistical tests or specific thresholds were applied beyond the standard outputs.
Utilizing the STRING database, we conducted network and pathway analyses to unveil functional connections and biological pathways related to our dataset. This database is a robust bioinformatics tool, integrating data from various sources on pathways, annotations, and protein-protein interactions. Differentially-expressed genes (DEGs) that met the criteria were subjected to statistical analysis and employed as inputs for STRING. A confidence score threshold (set at X, for high) ensured reliable interactions. The resulting protein–protein interaction network revealed tightly connected clusters representing similar functions or biological processes (
Fig. 1 Search Tool for the Retrieval of Interacting Genes/Proteins (STRING) network analysis.
The enrichment analysis identified pathways significantly affected by our research, offering crucial insights into chemical mechanisms and biological functions. These ensemble IDs are involved in the Go processes and functions, and Kyoto Encyclopedia of Genes and Genomes (KEGG) pathways (
| Ensemble IDs | Go process description | |
|---|---|---|
| ENSP00000258873 | Very long-chain fatty acid metabolic process | |
| ENSP00000422007 | Regulation of oxidative phosphorylation | |
| ENSP00000256389 | Reproduction | |
| ENSP00000483721 | The developmental process involved in reproduction | |
| ENSP00000341662 | Lipid metabolic process |
| Ensemble IDs | Diseases | |
|---|---|---|
| ENSP00000309052 | Complement component 2 deficiency, Male infertility | |
| ENSP00000219244 | Skin disease, Atopic dermatitis, Allergic contact dermatitis | |
| ENSP00000289429 | Immune system disease, Langerhans-cell histiocytosis | |
| ENSP00000315602 | Lower respiratory tract disease, Nicotine dependence | |
| ENSP00000407546 | Genetic disease, Chromosomal deletion syndrome, Chromosome 15q13.3 microdeletion syndrome |
| Ensemble IDs | Go functions | |
|---|---|---|
| ENSP00000422007 | Actin binding, Signaling receptor binding, Integrin binding | |
| ENSP00000256389 | Metalloendopeptidase activity, Catalytic activity | |
| ENSP00000483721 | Peptide receptor activity, G protein-coupled receptor activity | |
| ENSP00000341662 | Monooxygenase activity, Iron ion binding | |
| ENSP00000295897 | DNA binding, Copper ion binding |
This concise analysis enhances our understanding of the molecular landscape in the dataset. The SVM model's results are presented in
Fig. 2 Confusion matrix of the support vector machine SVM model of machine learning.
| Evaluation Matrices | Results |
|---|---|
| Accuracy | 0.8181818181818182 |
| Sensitivity | 0.0 |
| Specificity | 1.0 |
| Predicted positive | 0 |
| Predicted negative | 11 |
| F1 Score | Nan |
The decision tree model results are presented below in
Fig. 3 Confusion matrix of the decision tree model of machine learning.
| Evaluation Metrics | Results |
|---|---|
| Accuracy | 0.9615384615384616 |
| Sensitivity: ER+ | 0.95 |
| Sensitivity: HER2- | 1.0 |
| Specificity: ER+ | 0.95 |
| Specificity: HER2- | 1.0 |
| Predicted positive: ER+ | 1.0 |
| Predicted negative: HER2- | 0.95 |
| F1 score | 0.9743589743589743 |
Abbreviations: ER, estrogen receptor; HER2, and human epidermal growth factor receptor 2.
While our study successfully identified 396 differentially expressed genes across ER-positive (ER + ) and HER2-negative (HER2-) breast cancer subtypes, traditional methods often grapple with limitations in accuracy, scalability, and objectivity. This is where machine learning emerges as a beacon of hope. Both the SVM and decision tree models achieved remarkable performance, surpassing traditional methods with 96.15% accuracy and 95% sensitivity and specificity for both ER+ and HER2- detection. This paves the way for earlier, more precise diagnoses, potentially translating to improved patient outcomes. Also, machine learning has a great potential to interpret huge datasets and open the doors to more personalized and customized machines.
If the high-risk genes of specific subtypes of breast cancer are identified, then more targeted therapies and earlier detection can be made possible. Also, the network analysis of those genes using STRING will show to which other crucial pathways they are linked. It will have a great potential for novel therapeutic targets and personalized treatment plans. Moreover, integrating machine learning into our research showed great potential. The identified genes can be trained and serve as a model for more personalized treatment plans.
The primary aim of the present research was to find creative and innovative solutions to reduce the burden of breast cancer. We examined the samples of ER+ and HER2- breast cancer. It was discovered that 396 genes, linked with important processes inside the body, were differentially expressed. The related biological processes include purine nucleotide metabolism, lipid biosynthesis, and nervous system development. These biomarkers can now contribute to earlier detection and better treatment plans for breast cancer patients. However, there is still a dire need for additional validation of these biomarkers in a larger human population, as well as better understanding of the more precise functional role of targeted therapies, and innovation of techniques for earlier detection using ML, which has great potential. It can be used to create personalized treatment strategies and confirm these findings in real-world settings and clinical trials.
Breast cancer is a serious disease that must be diagnosed and categorized early to provide patients with an effective and personalized treatment.1 It is the most common disease, with higher incidence among women. According to the 2020 Global Cancer Statistics (GLOBOCAN),2 breast cancer was the most frequently detected type of cancer worldwide, having surpassed lung cancer,3 with 48 new reported cases per 100 thousand people yearly.2 Regardless of gender, the incidence is higher than any other type of cancer, and it is a very serious global concern.4
Various factors influence breast cancer, including age, gender, and mutations in the BRCA1 and BRCA2 genes, along with breast density, family history, hormonal changes, and previous radiation therapy.5 There is a dire need for self-examination for early detection and timely treatment outcomes.6 Breast cancer is classified based on receptors, such as the estrogen receptor (ER), the progesterone receptor (PR), and the human epidermal growth factor receptor 2 (HER2).7 These receptors play a vital role in determining treatment approaches, particularly in hormone receptor- and HER2-positive cases.8
Machine learning has emerged as a beacon of hope in recent years and has great potential for improved prognosis, precise diagnosis, and personalized treatment plans for breast cancer patients. The tumor stages also play a great role in this process.9 To understand the complexity of this disease, researchers use advanced techniques such as RNA sequencing (RNA-Seq) for gene expression profiling, support vector machine (SVM) Decision Tree for data analysis using machine learning, and other complex tools to understand pathways and networks, as well as analysis of biological pathways behind breast cancer.10 It makes diagnosis easier and more accurate, leading to personalized treatment plans and better outcomes for patients.11 The present research aims to target breast cancer at the molecular level so that better treatment plans can be designed for patient care.
The current research began with the collection of data from a functional genomics repository called ArrayExpress.
The datasets we selected had the E-GEOD-52194, E-GEOD-75367, and E-GEOD-58135 accession numbers, and then they had been preprocessed through the Galaxy platform, which was connected through the European Nucleotide Archive (ENA).
Data quality is a paramount concern, so we performed comprehensive preprocessing using two essential tools. The FastQC is instrumental for quality assessment in RNA-Seq analysis. It detects errors in data that might be misconstrued as biological signals, and identifies and aids in the removal of low-quality sequences. The FastQ Groomer tool ensures data integrity by checking for errors in FASTQ files and converting them between different formats while adhering to user-defined quality score criteria.
Furthermore, to align our readings, we harnessed the power and convenience of the Hierarchical Indexing for Spliced Alignment of Transcripts 2 (HISAT2), a swift and sensitive tool designed for mapping next-generation sequencing reads (DNA or RNA) to the human reference genome. This tool’s use of a small graph full-text minute-space (FM) enhances the precision of read alignment. To mitigate potential issues stemming from duplicate reads, we implemented a two-step process involving the following tools: MarkDuplicates identifies and tags duplicate reads originating from the same DNA fragment. This step is essential for avoiding errors resulting from polymerase chain reaction (PCR) duplicates.
The RmDup, a tool from SAMTools, further refines the data by retaining only the read pair with the best mapping quality when multiple pairs share the same external coordinates. We quantified RNA expression levels using the FeatureCounts tool from the Galaxy platform, leveraging the RmDup step’s file. To identify genes with differential expression, we employed the DESeq2 tool, which is robust for analyzing RNA-seq data and providing insights into gene expression differences.
Finally, we conducted pathway and network analysis using the Search Tool for the Retrieval of Interacting Genes/Proteins (STRING) database, which facilitates the exploration of relationships between genes, and their involvement in biological processes, molecular activities, cellular components, and pathways. Additionally, it allows for differential network analysis and the examination of gene pathways. We then performed machine learning algorithms to train our SVM and decision Tree models to reach the results.
For the differential expression analysis, we utilized DESeq2, which employs a negative binomial distribution model to identify differentially expressed genes. Statistical significance was determined using an adjusted p-value (false discovery rate, FDR) threshold < 0.05.
Accuracy, sensitivity, specificity, and F1 score were calculated for the SVM and decision rree models using true positives (TPs), true negatives (TNs), false positives (FPs), false negatives (FNs), precision, and recall as values. The formulas used for these metrics were:
Accuracy = (TP + TN) / (TP + TN + FP + FN)
Sensitivity = TP / (TP + FN)
Specificity = TN / (TN + FP)
F1 Score = 2 * (Precision * Recall) / (Precision + Recall)
We utilized the STRING database for network and pathway analyses to explore gene interactions and biological pathways associated with the differentially expressed genes. Gene interactions were assessed based on the database’s default settings and available interaction data.
Confidence Score Threshold: Our analysis relied on the database’s default confidence score settings. We did not apply a specific threshold for filtering gene interactions but used the default parameters.
Pathway Enrichment Analysis: The database provided insights into pathway enrichment and biological processes. No additional statistical tests or specific thresholds were applied beyond the standard outputs.
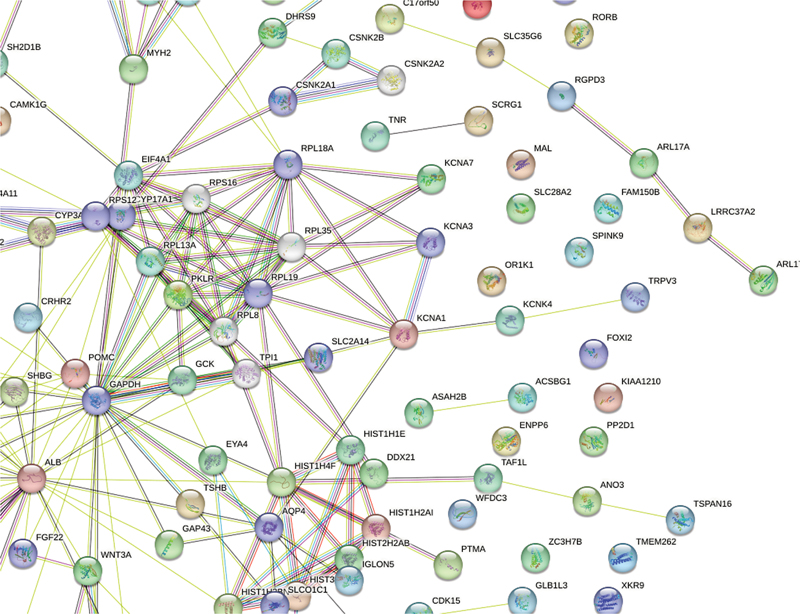
Utilizing the STRING database, we conducted network and pathway analyses to unveil functional connections and biological pathways related to our dataset. This database is a robust bioinformatics tool, integrating data from various sources on pathways, annotations, and protein-protein interactions. Differentially-expressed genes (DEGs) that met the criteria were subjected to statistical analysis and employed as inputs for STRING. A confidence score threshold (set at X, for high) ensured reliable interactions. The resulting protein–protein interaction network revealed tightly connected clusters representing similar functions or biological processes (Fig. 1).
Fig. 1 Search Tool for the Retrieval of Interacting Genes/Proteins (STRING) network analysis.
The enrichment analysis identified pathways significantly affected by our research, offering crucial insights into chemical mechanisms and biological functions. These ensemble IDs are involved in the Go processes and functions, and Kyoto Encyclopedia of Genes and Genomes (KEGG) pathways (Tables 1 2 3).
| Ensemble IDs | Go process description | |
|---|---|---|
| ENSP00000258873 | Very long-chain fatty acid metabolic process | |
| ENSP00000422007 | Regulation of oxidative phosphorylation | |
| ENSP00000256389 | Reproduction | |
| ENSP00000483721 | The developmental process involved in reproduction | |
| ENSP00000341662 | Lipid metabolic process |
| Ensemble IDs | Diseases | |
|---|---|---|
| ENSP00000309052 | Complement component 2 deficiency, Male infertility | |
| ENSP00000219244 | Skin disease, Atopic dermatitis, Allergic contact dermatitis | |
| ENSP00000289429 | Immune system disease, Langerhans-cell histiocytosis | |
| ENSP00000315602 | Lower respiratory tract disease, Nicotine dependence | |
| ENSP00000407546 | Genetic disease, Chromosomal deletion syndrome, Chromosome 15q13.3 microdeletion syndrome |
| Ensemble IDs | Go functions | |
|---|---|---|
| ENSP00000422007 | Actin binding, Signaling receptor binding, Integrin binding | |
| ENSP00000256389 | Metalloendopeptidase activity, Catalytic activity | |
| ENSP00000483721 | Peptide receptor activity, G protein-coupled receptor activity | |
| ENSP00000341662 | Monooxygenase activity, Iron ion binding | |
| ENSP00000295897 | DNA binding, Copper ion binding |
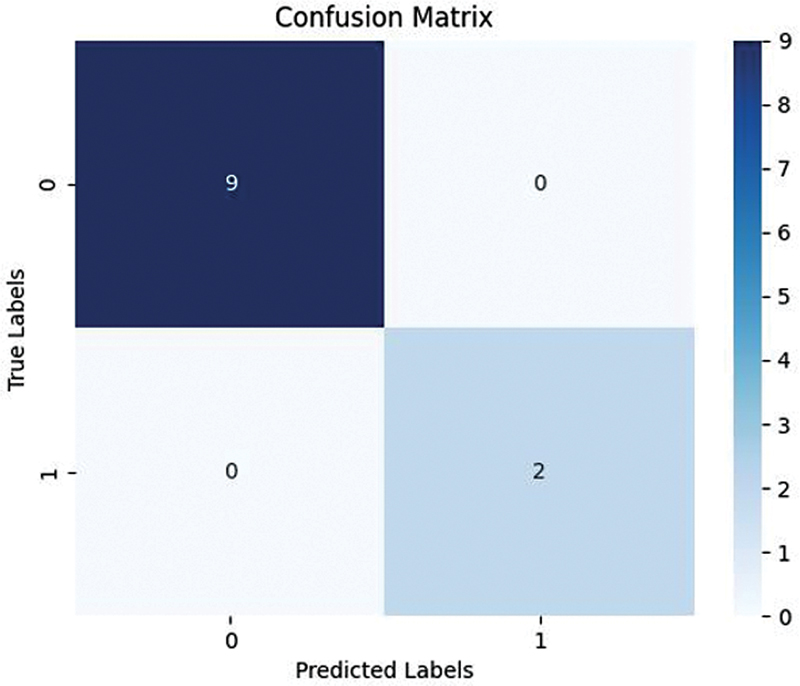
This concise analysis enhances our understanding of the molecular landscape in the dataset. The SVM model’s results are presented in Table 4 and Fig. 2, showing the heatmap with the contingency matrix.
Fig. 2 Confusion matrix of the support vector machine SVM model of machine learning.
| Evaluation Matrices | Results |
|---|---|
| Accuracy | 0.8181818181818182 |
| Sensitivity | 0.0 |
| Specificity | 1.0 |
| Predicted positive | 0 |
| Predicted negative | 11 |
| F1 Score | Nan |
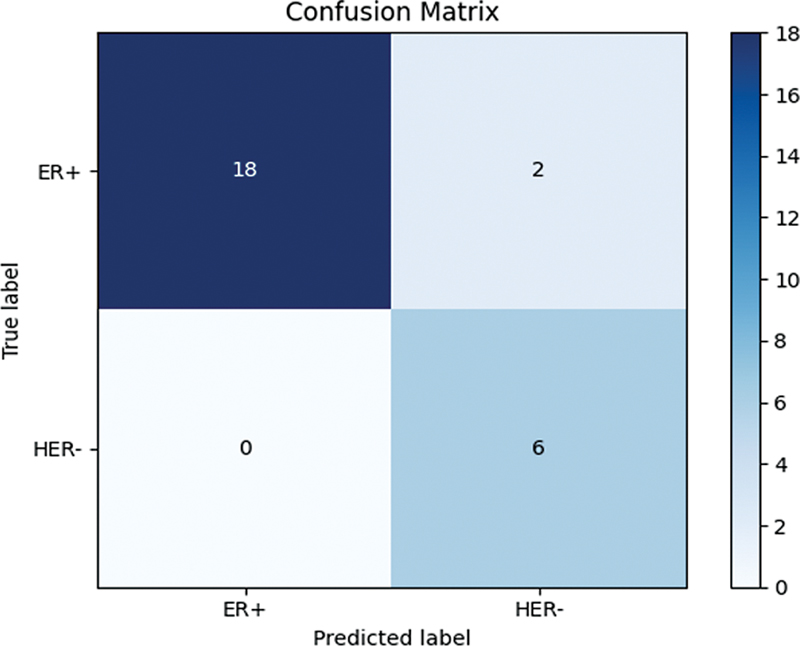
The decision tree model results are presented below in Table 5 and Fig. 3, showing the heatmap with the contingency matrix.
Fig. 3 Confusion matrix of the decision tree model of machine learning.
| Evaluation Metrics | Results |
|---|---|
| Accuracy | 0.9615384615384616 |
| Sensitivity: ER+ | 0.95 |
| Sensitivity: HER2- | 1.0 |
| Specificity: ER+ | 0.95 |
| Specificity: HER2- | 1.0 |
| Predicted positive: ER+ | 1.0 |
| Predicted negative: HER2- | 0.95 |
| F1 score | 0.9743589743589743 |
Abbreviations: ER, estrogen receptor; HER2, and human epidermal growth factor receptor 2.
While our study successfully identified 396 differentially expressed genes across ER-positive (ER + ) and HER2-negative (HER2-) breast cancer subtypes, traditional methods often grapple with limitations in accuracy, scalability, and objectivity. This is where machine learning emerges as a beacon of hope. Both the SVM and decision tree models achieved remarkable performance, surpassing traditional methods with 96.15% accuracy and 95% sensitivity and specificity for both ER+ and HER2- detection. This paves the way for earlier, more precise diagnoses, potentially translating to improved patient outcomes. Also, machine learning has a great potential to interpret huge datasets and open the doors to more personalized and customized machines.
If the high-risk genes of specific subtypes of breast cancer are identified, then more targeted therapies and earlier detection can be made possible. Also, the network analysis of those genes using STRING will show to which other crucial pathways they are linked. It will have a great potential for novel therapeutic targets and personalized treatment plans. Moreover, integrating machine learning into our research showed great potential. The identified genes can be trained and serve as a model for more personalized treatment plans.
The primary aim of the present research was to find creative and innovative solutions to reduce the burden of breast cancer. We examined the samples of ER+ and HER2- breast cancer. It was discovered that 396 genes, linked with important processes inside the body, were differentially expressed. The related biological processes include purine nucleotide metabolism, lipid biosynthesis, and nervous system development. These biomarkers can now contribute to earlier detection and better treatment plans for breast cancer patients. However, there is still a dire need for additional validation of these biomarkers in a larger human population, as well as better understanding of the more precise functional role of targeted therapies, and innovation of techniques for earlier detection using ML, which has great potential. It can be used to create personalized treatment strategies and confirm these findings in real-world settings and clinical trials.
Journal: Brazilian Journal of Oncology
DOI: 10.1055/s-00059887
e-issn: 2526-8732
Publisher: Thieme Revinter Publicações Ltda.
Publisher address: Rua do Matoso 170, Rio de Janeiro, RJ, CEP 20270-135, Brazil
Falha na comunicação com o serviço de processamento. Tente novamente.
1. Zhang, B N and Cao, X C and Chen, J Y. Guidelines on the diagnosis and treatment of breast cancer (2011 edition). Gland Surg [online]. 2012, vol. 1, p. 39-61.
2. Sung, H and Ferlay, J and Siegel, R L. Global Cancer Statistics 2020: GLOBOCAN Estimates of Incidence and Mortality Worldwide for 36 Cancers in 185 Countries. CA Cancer J Clin [online]. 2021, vol. 71, p. 209-249.
3. Feng, Y and Spezia, M and Huang, S. Breast cancer development and progression: Risk factors, cancer stem cells, signaling pathways, genomics, and molecular pathogenesis. Genes Dis [online]. 2018, vol. 5, p. 77-106.
4. [cited 2024 Mar 17]. Types of cancer [online]. Available from: <https://www.cancerresearchuk.org/about-cancer/what-is-cancer/how-cancer-starts/types-of-cancer>.
5. [cited 2024 Feb 17] [online]. Available from: <https://www.mdpi.com/2072-6694/16/3/579>.
6. Khatib, O MN and Modjtabai, A. Guidelines for the early detection and screening of breast cancer [online]. Available from: <>.
7. [cited 2024 Feb 17] [online]. Available from: <https://www.ncbi.nlm.nih.gov/pmc/articles/PMC7375990/>.
8. [cited 2024 Feb 17] [online]. Available from: <https://www.nature.com/articles/s41523-023-00533-2>.
9. [cited 2024 Feb 17] [online]. Available from: <https://www.cancer.org/cancer/types/breast-cancer/understanding-a-breast-cancer-diagnosis/stages-of-breast-cancer.html>.
10. Alharbi, F and Vakanski, A. Machine Learning Methods for Cancer Classification Using Gene Expression Data: A Review. Bioengineering (Basel) [online]. 2023, vol. 10, p. 173.
11. [cited 2024 Feb 17] [online]. Available from: <https://www.ncbi.nlm.nih.gov/pmc/articles/PMC10625863/>.
Dados de acesso insuficientes para visualização no mapa.