
Cancer is one of the leading cause of deaths. In 2022, an estimated 20 million new cases and 9.7 million deaths occurred worldwide. Overall, the burden of incidence of cancer and mortality caused by it is in a phase of acceleration, with demographic predictions indicating that the number of new cases will reach 35 million by 2050. In India, the cumulative risk of incidence of malignancy for the same period was of 10.62% for male patients and of 10.68% for female patients, whereas the cumulative risk of mortality due to cancer was of 7.48% for male subjects and 6.95% for female subjects.
There are many false beliefs and myths about cancer which form the basis of people's attitude and their response towards the disease.
Exploring the mindset of cancer patients regarding the myths surrounding cancer is of utmost importance to the treating oncologist as well as to the general population. It is essential to address these erroneous perceptions in order to move closer towards the ultimate goal of improving treatment and patient care.
Unfortunately, there is a scarcity of adequate research on this issue, especially in Eastern India. In an attempt to fill this gap, we have undertaken the current study, which aims to shed some light on the myths and misconceptions prevalent among cancer patients and their caregivers regarding the disease and its treatment. We herein present our findings related to the perceptions among cancer patients.
We conducted a cross-sectional and observational study involving face-to-face interviews with the cancer patients attending the Radiation Oncology Department of a peripherally-located tertiary cancer care hospital in Eastern India. A convenience sampling design was used to enroll the subjects.
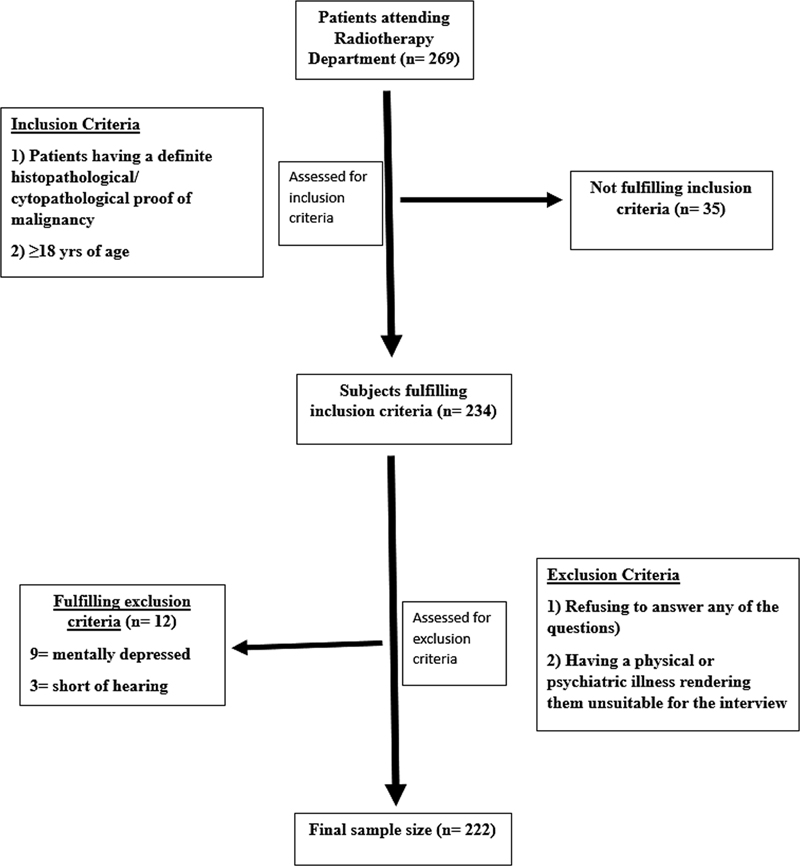
We included patients with definite cytological/histological proof of malignancy, older than 18 years of age, who provided written informed consent. Those with significant physical or psychiatric issues rendering them unsuitable for the interview were excluded from the study (
Fig. 1 Strengthening the Reporting of Observational Studies in Epidemiology (STROBE) diagram showing the enrolment of study participants.
The sample size for the study was estimated to be of 282 subjects. Details on the sample size calculation are shown in
| Variable | Category | |
|---|---|---|
| Age in years: median (interquartile range) | 51.5 (44–60) | |
| Gender: n (%) | Female Male | 129 (58.10) 93 (41.90) |
| Domicile: n (%) | Rural Urban | 170 (76.60) 52 (23.40) |
| Level of schooling: n (%) | Illiterate Primary Secondary Higher secondary Graduate Postgraduate | 89 (40.10) 106 (47.70) 15 (6.80) 6 (2.70) 4 (1.80) 2 (0.90) |
| Occupation: n (%) | Homemaker Farmer Unemployed Others* | 89 (40.10) 46 (20.70) 16 (7.30) 71 (31.98) |
| Monthly family income (in INR): n (%) | < 10,000 ≥ 10,000 | 138 (62.2) 84 (37.8) |
Note: *Includes students, manual laborers, skilled workers/craftsmen, professionals etc.
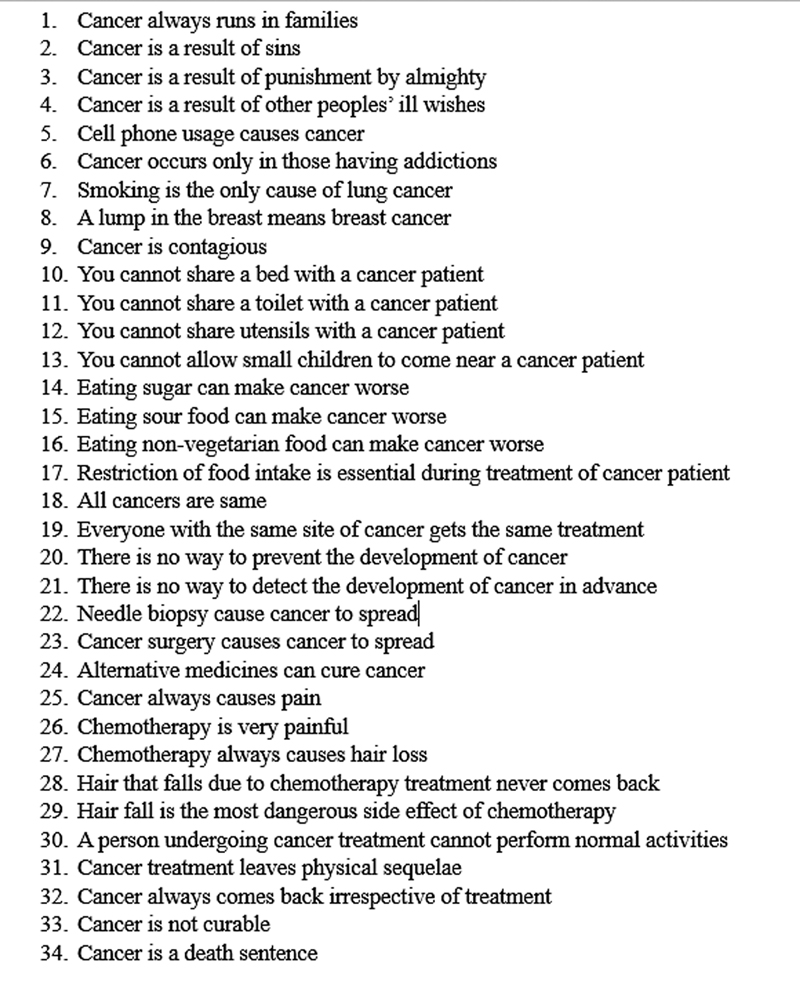
A questionnaire was developed for the study after an interaction with 50 subjects (25 patients and 25 caregivers) to identify the main perceptions and myths prevalent in the target population. The aspects that were addressed included sociodemographic factors, disease-related parameters, and the perceptions about cancer and its treatment (
Fig. 2 Questions included in the questionnaire.
The questions were framed in such a manner that answering “yes” would indicate agreeing to the false statement embodied by the question or believing in the myth. “Yes” answers were assigned a score of 1, and the “no” or “I don't know” answers, 0.
Myth score: A myth may be defined as beliefs held to be true despite refuting evidence. The myth score was calculated by adding all the “yes” answers of an individual subject. Thus, the score ranged from 1 to 34 points.
Myth index (MI): it was calculated for each subject using the following formula:
in which M1, M2, ............. Mn are the “yes” answers to the first, second, ........ and nth question, and N is the number of questions (in this case, N = 34). The MI is expressed as a percentage.
A high myth score and a high MI would indicate harboring a significantly-high number of false beliefs on cancer. We assumed that subjects who had myth scores greater than 10 (corresponding approximately to an MI ≥ 30%) had sufficient belief in wrong perceptions or myths to be considered “high”. Hence, we chose an arbitrary value of MI ≥ 30% as high, for the subsequent analyses with respect to sociodemographic predictor variables.
The predictor variables assessed were namely age, gender, domicile, schooling, income, disease stage, Performance Status (PS) score on the Eastern Cooperative Oncology Group (ECOG) Scale, intent of treatment, and treatment status.
A comparative analysis was performed with cross tables, as well as the Kruskal Wallis test, to try to find associations involving the predictor variables and the MI. The role of sociodemographic and disease-related parameters as predictors of high MI were assessed using logistic regression analysis. The Spearman rank test was used to measure the direction and strength of the correlations regarding the sociodemographic variables and the MI. Values of p < 0.05 were considered statistically significant. All p-values mentioned are two-tailed.
Data analysis was performed using the IBM SPSS Statistics fro Windows (IBM Corp.) software, version 26.0, and the Microsoft Excel (Microsoft Corp.) software.
Between August and December 2023, among the cancer patients attending the outpatient department of our institution, we selected 234 who fulfilled the inclusion criteria, but 12 of them were excluded as per the exclusion criteria; therefore, 222 subjects were interviewed. (
The median age of the subjects was of 51.5 (interquartile range [IQR]: 44–60) years, and 129 (58.1%) of the participants were of the female gender. Most of them lived in rural households (76.6%) and had completed primary education (48.2%). Out of all the subjects, 88 (39.5%) were homemakers and most (62.2%) had a monthly family income below INR 10,000. Details on the demographic characteristics are presented in
The most common primary site of cancer diagnosis was the breast (20.50%), followed by the uterine cervix (16.2%) and the head and neck (15.4%). The most common stage group (as per the 8th edition of the American Joint Committee on Cancer [AJCC] Tumor, Node, Metastasis [TNM] staging system) at presentation was III (32.6%), followed by IV (31.7%) and II (27.5%). The median follow-up was of 14.5 months.
| Aspect | Perception statement | Believers in the wrong perception/myth: n (%) |
|---|---|---|
| Cultural beliefs | Cancer is the result of ones' sins | 44 (19.8) |
| Cancer is a result of God's wish | 150 (67.6) | |
| Cancer is a death sentence | 10 (4.5) | |
| Curability | Cancer is not curable | 27 (12.2) |
| Contagiousness | Cancer is contagious | 45 (20.3) |
| One cannot share a bed with a cancer patient | 45 (20.3) | |
| One cannot share a toilet with a cancer patient | 43 (19.4) | |
| One cannot share utensils with a cancer patient | 50 (22.5) | |
| One cannot allow small children in the house to come near a cancer patient | 46 (20.7) | |
| Diet | Eating sweet foods can make cancer worse | 63 (28.4) |
| Eating sour foods can make cancer worse | 53 (23.9) | |
| Causation of lung cancer | Smoking is the only cause of lung cancer | 50 (22.5) |
| Screening and treatment | There is no way to detect the development of cancer in advance | 50 (22.5) |
| Everyone with the same cancer site gets the same treatment | 45 (20.3) | |
| Hazards of biopsy and surgery | Needle biopsy causes the spread of cancer | 40 (18.0) |
| Cancer surgery causes the spread of cancer | 37 (16.7) | |
| Alternative medicine | Alternative medicines can cure cancer | 33 (14.9) |
| Effects of chemotherapy and treatment | Chemotherapy is very painful | 64 (28.8) |
| Chemotherapy always causes hair loss | 160 (72.1) | |
| Hair loss is the most dreaded side effect of chemotherapy | 58 (26.1) | |
| Cancer treatment leaves permanent physical sequelae | 136 (61.3) |
The maximum myth score was 22 (median; 7; IQR: 4–10) points. In total 25.4% of the subjects had a myth score < 5 points, 53.8%, scores from 5 to 10 points, and 47 subjects (21.3%), ≥ 10 points.
The maximum MI was of 64.71%. A total of 33 (14.86%) patients had an MI ≤ 10%, 61 (27.47%), MI from 10 to 20%, 81 (36.48%), MI from 20 to 30%, and 47 (21.17%), MI > 30%.
Of all the predictors of high MI, lack of schooling (the MI was high in 25.0% of the illiterate subjects versus 22.0% among those with primary education) was found to have a statistically significant association (
| Predictor | N | Subjects with high Myth index (≥ 30%): n (%) | p-value | |
|---|---|---|---|---|
| Gender | Male | 93 | 17 (18.27) | 0.371 |
| Female | 129 | 30 (23.25) | ||
| Age in years | < 38 | 26 | 3 (11.53) | 0.201 |
| ≥ 38 | 196 | 44 (22.45) | ||
| Domicile | Rural | 170 | 40 (23.52) | 0.120 |
| Urban | 52 | 7 (13.46) | ||
| Level of schooling | Illiterate | 89 | 25 (28.08) | 0.007* |
| Primary education | 106 | 22 (20.75) | ||
| Higher education | 27 | 0 (00.00) | ||
| Income (in INR) | < 10,000 | 138 | 28 (20.28) | 0.680 |
| ≥ 10,000 | 84 | 19 (22.61) | ||
| Disease stage | I or II | 78 | 11 (14.10) | 0.058 |
| III or IV | 144 | 36 (25.00) | ||
| ECOG PS score | < 2 | 329 | 77 (23.45) | 0.466 |
| ≥ 2 | 27 | 8 (29.62) | ||
| Intent of treatment | Curative | 177 | 34 (19.20) | 0.156 |
| Palliative | 45 | 13 (28.89) | ||
| Treatment status | Treatment naïve | 16 | 2 (12.50) | 0.487 |
| Undergoing treatment | 193 | 41 (21.24) | ||
| On follow-up | 13 | 4 (30.76) | ||
Abbreviation: ECOG PS, Eastern Cooperative Oncology Group (ECOG) Performance Status Scale.
Note: *Statistically significant (p < 0.05).
Very weak correlations were observed regarding the various sociodemographic variables and the MI (
Univariate logistic regression detected no significant predictors of high MI (≥ 30%) among the subjects. (
The present study sheds light onto the various myths and beliefs about cancer, not only in the general population, but also among the cancer patients. These misconceptions lead to actions that can hamper the early detection of cancer and its optimal treatment.
Myths about etiology lead to late detection. In a study with a few terminally-ill cancer patients by Pahwa et al.,
Kishore et al.
We found 22.5% of the participants believed there was no way to detect cancer in advance, and that 14.9% believed that alternative medicines could cure cancer. While the first belief may lead to ignorance regarding population screening and the benefits of early diagnosis, the second might delay a visit to an oncologist.
Rao et al.
Amongst the patients, 23.9% and 28.4% respectively believed that consumption of sour and sweet foods caused worsening of cancer symptoms. Avoiding specific tastes could jeopardize the diet of the cancer patient, especially those suffering from treatment-induced dysgeusia and anorexia, and further compromise nutrition.
The assessment of the data showed that 28.8% were afraid chemotherapy is always painful, while 72.1% and 61.3% respectively believed that chemotherapy always causes hair loss and permanent physical sequelae. These myths might lead to avoidance of chemotherapy and non-compliance with treatment.
Dardas and Ahmad
In the current study, lack of schooling was found to be significantly associated with a higher degree of false perceptions among the patients.
To the best of our knowledge, the current is the first study from Eastern India exploring the various myths and perceptions held by cancer patients regarding various aspects of cancer causation, diagnosis, and treatment. Our population of 222 cancer patients was sizeable, and a significant number of factors associated with higher levels of misconceptions were identified.
The present was a single-center study conducted over a brief time period implementing the technique of convenience sampling, thus limiting the generalizability of the findings to the entire population. Moreover, there was a possibility that the subjects were aware of being judged during the interview and gave ideal answers as opposed to what they actually believe.
To the best of our knowledge, the current is probably the first study from Eastern India of its kind, to extensively quantify the false perceptions about the various aspects of cancer that are prevalent among cancer patients. The perceptions and the attitude of cancer patients play a vital role in the entire continuum of their own care pathway, and they often act as guiding factors for the delivery of proper treatment. The present study found a clear relationship between heightened misconceptions among cancer patients and the lack of proper schooling among them. We hope the study will help in the development of health policies tailored to cancer patients and enhance cancer awareness and education among the masses by targeting specific perceptions. The numerous social stigmas that ostracize the cancer patient, often within the family as well, could also be addressed objectively from the findings of the current study.
Cancer is one of the leading cause of deaths. In 2022, an estimated 20 million new cases and 9.7 million deaths occurred worldwide. Overall, the burden of incidence of cancer and mortality caused by it is in a phase of acceleration, with demographic predictions indicating that the number of new cases will reach 35 million by 2050. In India, the cumulative risk of incidence of malignancy for the same period was of 10.62% for male patients and of 10.68% for female patients, whereas the cumulative risk of mortality due to cancer was of 7.48% for male subjects and 6.95% for female subjects.1 The survival rates in cancer patients in India are quite inferior, of approximately less than half of those in advanced countries.2
There are many false beliefs and myths about cancer which form the basis of people’s attitude and their response towards the disease.3 These misconceptions, which are prevalent among the general population, are not backed by logical reasoning, and they are often refuted by scientific evidence.4 The lesser the knowledge about cancer, the more substantial the myths—many of which are deeply ingrained and, therefore, are harder to rectify.5 These beliefs lead to delays in seeking medical attention by protracting the interval between the onset of symptoms and the initial visit to the treating oncologist. False cultural perceptions gravely affect cancer care throughout the entire disease continuum—from prevention and early detection to patient care during treatment, compliance rates, management of side effects, appropriate psychosocial support, efforts for rehabilitation, cancer survivorship, hospice care, and proper end-of-life care.6
Exploring the mindset of cancer patients regarding the myths surrounding cancer is of utmost importance to the treating oncologist as well as to the general population. It is essential to address these erroneous perceptions in order to move closer towards the ultimate goal of improving treatment and patient care.
Unfortunately, there is a scarcity of adequate research on this issue, especially in Eastern India. In an attempt to fill this gap, we have undertaken the current study, which aims to shed some light on the myths and misconceptions prevalent among cancer patients and their caregivers regarding the disease and its treatment. We herein present our findings related to the perceptions among cancer patients.
We conducted a cross-sectional and observational study involving face-to-face interviews with the cancer patients attending the Radiation Oncology Department of a peripherally-located tertiary cancer care hospital in Eastern India. A convenience sampling design was used to enroll the subjects.
We included patients with definite cytological/histological proof of malignancy, older than 18 years of age, who provided written informed consent. Those with significant physical or psychiatric issues rendering them unsuitable for the interview were excluded from the study (Fig. 1).
Fig. 1 Strengthening the Reporting of Observational Studies in Epidemiology (STROBE) diagram showing the enrolment of study participants.
The sample size for the study was estimated to be of 282 subjects. Details on the sample size calculation are shown in Supplementary File 1.
| Variable | Category | |
|---|---|---|
| Age in years: median (interquartile range) | 51.5 (44–60) | |
| Gender: n (%) | Female Male | 129 (58.10) 93 (41.90) |
| Domicile: n (%) | Rural Urban | 170 (76.60) 52 (23.40) |
| Level of schooling: n (%) | Illiterate Primary Secondary Higher secondary Graduate Postgraduate | 89 (40.10) 106 (47.70) 15 (6.80) 6 (2.70) 4 (1.80) 2 (0.90) |
| Occupation: n (%) | Homemaker Farmer Unemployed Others* | 89 (40.10) 46 (20.70) 16 (7.30) 71 (31.98) |
| Monthly family income (in INR): n (%) | < 10,000 ≥ 10,000 | 138 (62.2) 84 (37.8) |
Note: *Includes students, manual laborers, skilled workers/craftsmen, professionals etc.
A questionnaire was developed for the study after an interaction with 50 subjects (25 patients and 25 caregivers) to identify the main perceptions and myths prevalent in the target population. The aspects that were addressed included sociodemographic factors, disease-related parameters, and the perceptions about cancer and its treatment (Fig. 2). Perceptions related to cultural beliefs, contagiousness, diet, screening, the hazards of biopsy and surgery, alternative medication use, chemotherapy-induced pain, hair loss, and curability of the disease were assessed using 34 questions which could be answered as “yes”, “no”, or “I don’t know”. The questionnaire was pretested among a group of 15 patients to gauge the clarity of understanding, ambiguity, comprehensibility, and uniformity. The validation resulted in some changes; thereafter, the final version was prepared. The study proposal was submitted to the institutional Ethics in Research Committee and, after getting written clearance, trained physicians conducted face-to-face interviews with the subjects. The interviewees were assured of data confidentiality and that this interview would have no impact on their treatment. The data thus collected was compiled and subjected to a statistical analysis.
Fig. 2 Questions included in the questionnaire.
The questions were framed in such a manner that answering “yes” would indicate agreeing to the false statement embodied by the question or believing in the myth. “Yes” answers were assigned a score of 1, and the “no” or “I don’t know” answers, 0.
Myth score: A myth may be defined as beliefs held to be true despite refuting evidence. The myth score was calculated by adding all the “yes” answers of an individual subject. Thus, the score ranged from 1 to 34 points.
Myth index (MI): it was calculated for each subject using the following formula:
in which M1, M2, …………. Mn are the “yes” answers to the first, second, …….. and nth question, and N is the number of questions (in this case, N = 34). The MI is expressed as a percentage.
A high myth score and a high MI would indicate harboring a significantly-high number of false beliefs on cancer. We assumed that subjects who had myth scores greater than 10 (corresponding approximately to an MI ≥ 30%) had sufficient belief in wrong perceptions or myths to be considered “high”. Hence, we chose an arbitrary value of MI ≥ 30% as high, for the subsequent analyses with respect to sociodemographic predictor variables.
The predictor variables assessed were namely age, gender, domicile, schooling, income, disease stage, Performance Status (PS) score on the Eastern Cooperative Oncology Group (ECOG) Scale, intent of treatment, and treatment status.
A comparative analysis was performed with cross tables, as well as the Kruskal Wallis test, to try to find associations involving the predictor variables and the MI. The role of sociodemographic and disease-related parameters as predictors of high MI were assessed using logistic regression analysis. The Spearman rank test was used to measure the direction and strength of the correlations regarding the sociodemographic variables and the MI. Values of p < 0.05 were considered statistically significant. All p-values mentioned are two-tailed.
Data analysis was performed using the IBM SPSS Statistics fro Windows (IBM Corp.) software, version 26.0, and the Microsoft Excel (Microsoft Corp.) software.
Between August and December 2023, among the cancer patients attending the outpatient department of our institution, we selected 234 who fulfilled the inclusion criteria, but 12 of them were excluded as per the exclusion criteria; therefore, 222 subjects were interviewed. (Fig. 1).
The median age of the subjects was of 51.5 (interquartile range [IQR]: 44–60) years, and 129 (58.1%) of the participants were of the female gender. Most of them lived in rural households (76.6%) and had completed primary education (48.2%). Out of all the subjects, 88 (39.5%) were homemakers and most (62.2%) had a monthly family income below INR 10,000. Details on the demographic characteristics are presented in Table 1.
The most common primary site of cancer diagnosis was the breast (20.50%), followed by the uterine cervix (16.2%) and the head and neck (15.4%). The most common stage group (as per the 8th edition of the American Joint Committee on Cancer [AJCC] Tumor, Node, Metastasis [TNM] staging system) at presentation was III (32.6%), followed by IV (31.7%) and II (27.5%). The median follow-up was of 14.5 months.
Table 2 shows the percentage of subjects who believed in myths regarding various aspects of cancer. More than half (56%) believed cancer was a result of God’s wish, and about 20% believed it to be contagious (thus, sharing same bed, food or utensils with a patient could give rise to cancer). Around 28% and 24% believed that cancer was caused by eating sweet or sour food respectively. Alarmingly, 18% and 16.7% believed that a needle biopsy or surgery for cancer, respectively, causes cancer to spread. About 15% believed that alternative medicines can cure cancer. Almost 28.8% felt chemotherapy was very painful. and a 61.3% of the caregivers felt that cancer treatment always left behind permanent physical sequelae.
| Aspect | Perception statement | Believers in the wrong perception/myth: n (%) |
|---|---|---|
| Cultural beliefs | Cancer is the result of ones’ sins | 44 (19.8) |
| Cancer is a result of God’s wish | 150 (67.6) | |
| Cancer is a death sentence | 10 (4.5) | |
| Curability | Cancer is not curable | 27 (12.2) |
| Contagiousness | Cancer is contagious | 45 (20.3) |
| One cannot share a bed with a cancer patient | 45 (20.3) | |
| One cannot share a toilet with a cancer patient | 43 (19.4) | |
| One cannot share utensils with a cancer patient | 50 (22.5) | |
| One cannot allow small children in the house to come near a cancer patient | 46 (20.7) | |
| Diet | Eating sweet foods can make cancer worse | 63 (28.4) |
| Eating sour foods can make cancer worse | 53 (23.9) | |
| Causation of lung cancer | Smoking is the only cause of lung cancer | 50 (22.5) |
| Screening and treatment | There is no way to detect the development of cancer in advance | 50 (22.5) |
| Everyone with the same cancer site gets the same treatment | 45 (20.3) | |
| Hazards of biopsy and surgery | Needle biopsy causes the spread of cancer | 40 (18.0) |
| Cancer surgery causes the spread of cancer | 37 (16.7) | |
| Alternative medicine | Alternative medicines can cure cancer | 33 (14.9) |
| Effects of chemotherapy and treatment | Chemotherapy is very painful | 64 (28.8) |
| Chemotherapy always causes hair loss | 160 (72.1) | |
| Hair loss is the most dreaded side effect of chemotherapy | 58 (26.1) | |
| Cancer treatment leaves permanent physical sequelae | 136 (61.3) |
The maximum myth score was 22 (median; 7; IQR: 4–10) points. In total 25.4% of the subjects had a myth score < 5 points, 53.8%, scores from 5 to 10 points, and 47 subjects (21.3%), ≥ 10 points.
The maximum MI was of 64.71%. A total of 33 (14.86%) patients had an MI ≤ 10%, 61 (27.47%), MI from 10 to 20%, 81 (36.48%), MI from 20 to 30%, and 47 (21.17%), MI > 30%.
Of all the predictors of high MI, lack of schooling (the MI was high in 25.0% of the illiterate subjects versus 22.0% among those with primary education) was found to have a statistically significant association (Table 3).
| Predictor | N | Subjects with high Myth index (≥ 30%): n (%) | p-value | |
|---|---|---|---|---|
| Gender | Male | 93 | 17 (18.27) | 0.371 |
| Female | 129 | 30 (23.25) | ||
| Age in years | < 38 | 26 | 3 (11.53) | 0.201 |
| ≥ 38 | 196 | 44 (22.45) | ||
| Domicile | Rural | 170 | 40 (23.52) | 0.120 |
| Urban | 52 | 7 (13.46) | ||
| Level of schooling | Illiterate | 89 | 25 (28.08) | 0.007* |
| Primary education | 106 | 22 (20.75) | ||
| Higher education | 27 | 0 (00.00) | ||
| Income (in INR) | < 10,000 | 138 | 28 (20.28) | 0.680 |
| ≥ 10,000 | 84 | 19 (22.61) | ||
| Disease stage | I or II | 78 | 11 (14.10) | 0.058 |
| III or IV | 144 | 36 (25.00) | ||
| ECOG PS score | < 2 | 329 | 77 (23.45) | 0.466 |
| ≥ 2 | 27 | 8 (29.62) | ||
| Intent of treatment | Curative | 177 | 34 (19.20) | 0.156 |
| Palliative | 45 | 13 (28.89) | ||
| Treatment status | Treatment naïve | 16 | 2 (12.50) | 0.487 |
| Undergoing treatment | 193 | 41 (21.24) | ||
| On follow-up | 13 | 4 (30.76) | ||
Abbreviation: ECOG PS, Eastern Cooperative Oncology Group (ECOG) Performance Status Scale.
Note: *Statistically significant (p < 0.05).
Very weak correlations were observed regarding the various sociodemographic variables and the MI (Supplementary File 2; Supplementary Table S1).
Univariate logistic regression detected no significant predictors of high MI (≥ 30%) among the subjects. (Supplementary File 3; Supplementary Table S2).
The present study sheds light onto the various myths and beliefs about cancer, not only in the general population, but also among the cancer patients. These misconceptions lead to actions that can hamper the early detection of cancer and its optimal treatment.
Myths about etiology lead to late detection. In a study with a few terminally-ill cancer patients by Pahwa et al.,7 the common opinion was that cancer was the result of punishment for “bad karma.” Kishore et al.8 reported similar observations. In the current study, 19.8% of the subjects believed that cancer is a result of sins from a past life, and 67.6% believed that cancer is a result of God’s wish.
Kishore et al.8 observed that cancer was deemed to be both a communicable and an incurable disease. Ray and Mandal9 reported that more than 11% of the subjects believed that the cancer diagnosis causes denouncement, and that it should be kept a secret. In the present study, 20.3% of the subjects believed that cancer was a contagious disease. This domain is especially important because, with this belief, caregivers can avoid sharing food or utensils with patients and prevent children from coming near or sleeping with the patients in the same bed or room. This can cause social stigma, isolation and ostracization of the cancer patient, thus grossly degrading their social life and harming their psyche. In the current study, a substantial number of participants felt that cancer was incurable and a proverbial “death sentence”. These beliefs create hopelessness and may lead to treatment avoidance.
We found 22.5% of the participants believed there was no way to detect cancer in advance, and that 14.9% believed that alternative medicines could cure cancer. While the first belief may lead to ignorance regarding population screening and the benefits of early diagnosis, the second might delay a visit to an oncologist.
Rao et al.10 found a major belief among their study subjects that biopsy and surgery can result in the spread of cancer. In the present study, alarmingly, 18.0% and 16.7% believed that a biopsy or surgery, respectively, could cause cancer to spread. These beliefs pose a major hindrance to timely diagnosis and radical treatment of cancer.
Amongst the patients, 23.9% and 28.4% respectively believed that consumption of sour and sweet foods caused worsening of cancer symptoms. Avoiding specific tastes could jeopardize the diet of the cancer patient, especially those suffering from treatment-induced dysgeusia and anorexia, and further compromise nutrition.
The assessment of the data showed that 28.8% were afraid chemotherapy is always painful, while 72.1% and 61.3% respectively believed that chemotherapy always causes hair loss and permanent physical sequelae. These myths might lead to avoidance of chemotherapy and non-compliance with treatment.
Dardas and Ahmad11 found that male gender and old age were correlated with higher levels of belief that a cancer diagnosis is a stigma, and that there is no cure for it. They also found that participants with higher education and higher income tended to agree less that “cancer is a stigma-provoking diagnosis.”
In the current study, lack of schooling was found to be significantly associated with a higher degree of false perceptions among the patients.
To the best of our knowledge, the current is the first study from Eastern India exploring the various myths and perceptions held by cancer patients regarding various aspects of cancer causation, diagnosis, and treatment. Our population of 222 cancer patients was sizeable, and a significant number of factors associated with higher levels of misconceptions were identified.
The present was a single-center study conducted over a brief time period implementing the technique of convenience sampling, thus limiting the generalizability of the findings to the entire population. Moreover, there was a possibility that the subjects were aware of being judged during the interview and gave ideal answers as opposed to what they actually believe.
To the best of our knowledge, the current is probably the first study from Eastern India of its kind, to extensively quantify the false perceptions about the various aspects of cancer that are prevalent among cancer patients. The perceptions and the attitude of cancer patients play a vital role in the entire continuum of their own care pathway, and they often act as guiding factors for the delivery of proper treatment. The present study found a clear relationship between heightened misconceptions among cancer patients and the lack of proper schooling among them. We hope the study will help in the development of health policies tailored to cancer patients and enhance cancer awareness and education among the masses by targeting specific perceptions. The numerous social stigmas that ostracize the cancer patient, often within the family as well, could also be addressed objectively from the findings of the current study.
Journal: Brazilian Journal of Oncology
DOI: 10.1055/s-00059887
e-issn: 2526-8732
Publisher: Thieme Revinter Publicações Ltda.
Publisher address: Rua do Matoso 170, Rio de Janeiro, RJ, CEP 20270-135, Brazil
Falha na comunicação com o serviço de processamento. Tente novamente.
1. Bray, F and Laversanne, M and Sung, H. Global cancer statistics 2022: GLOBOCAN estimates of incidence and mortality worldwide for 36 cancers in 185 countries. CA Cancer J Clin [online]. 2024, vol. 74, p. 229-263. https://doi.org/10.3322/caac.21834 Ver referência
2. Parkin, D M and Bray, F and Ferlay, J and Pisani, P. Global cancer statistics, 2002. CA Cancer J Clin [online]. 2005, vol. 55, p. 74-108. https://doi.org/10.3322/canjclin.55.2.74 Ver referência
3. Berkman, B and Rohan, B and Sampson, S. Myths and biases related to cancer in the elderly. Cancer [online]. 1994, vol. 74, p. 2004-2008. https://doi.org/10.1002/1097-0142(19941001)74:7+3.0.co;2-w Ver referência
4. Halpern, M and Mollica, M A and Han, P KJ and Tonorezos, E S. Myths and Presumptions About Cancer Survivorship. J Clin Oncol [online]. 2024, vol. 42, p. 134-139. https://doi.org/10.1200/JCO.23.00631 Ver referência
5. Leigh, S. Myths, monsters, and magic: personal perspectives and professional challenges of survival. Oncol Nurs Forum [online]. 1992, vol. 19, p. 1475-1480.
6. Kagawa-Singer, M. A socio-cultural perspective on cancer control issues for Asian Americans. Asian Am Pac Isl J Health [online]. 2000, vol. 8, p. 12-17.
7. Pahwa, M and Babu, N and Bhatnagar, S. Fighting cancer is half the battle... living life is the other half. J Cancer Res Ther [online]. 2005, vol. 1, p. 98-102. https://doi.org/10.4103/0973-1482.16709 Ver referência
8. Kishore, J and Ahmad, I and Kaur, R and PK, M. Beliefs and perceptions about cancers among patients attending radiotherapy OPD in Delhi, India. Asian Pac J Cancer Prev [online]. 2008, vol. 9, p. 155-158.
9. Ray, K and Mandal, S. Knowledge about cancer in West Bengal - a pilot survey. Asian Pac J Cancer Prev [online]. 2004, vol. 5, p. 205-212.
10. Rao, R R and Acharya, A P and Bajpai, P. Cancer Awareness amongst Nurses in a Tertiary Care Hospital in North Delhi, India. Indian J Med Paediatr Oncol [online]. 2019, vol. 40, p. S89-S94. https://doi.org/10.4103/ijmpo.ijmpo_159_17 Ver referência
11. Dardas, L A and Ahmad, M M. Myths and Misconceptions about Cancer: Findings from Jordan. Medicine Journal [online]. 2015, vol. 2, p. 88-93.

Dados de acesso insuficientes para visualização no mapa.